


Traders have a range of chart types to choose from when analyzing financial markets, with tick-based and time-based charts being two of the most popular options. This creates what I like to call the tik vs tok argument, where tik refers to tick-based chart analysis, and tok refers to time-based chart analysis. Each type of chart has its own distinct advantages, and comprehending these benefits can help traders make informed decisions about which chart type to use for their analysis. In this article, we will delve into the differences between tick-based and time-based charts and examine what each has to offer.
Tick-Based Charts
Tick-based charts display price movements based on the number of trades that occur. Each tick represents a transaction that has taken place, and the chart is updated after each tick. For example, a tick chart may display a new bar every time 100 trades occur.
One of the main benefits of tick-based charts is that they provide a more accurate representation of market activity. Because each tick represents a transaction, tick charts can capture price movements that may not be visible on time-based charts. Tick charts can also be useful for identifying trends and patterns in the market that may not be evident on a time-based chart.
Another benefit of tick-based charts is that they can help traders identify support and resistance levels more accurately. This is because tick charts can reveal price movements that occur within a specific price range, making it easier to identify key levels of support and resistance.
However, tick-based charts can be challenging to use for traders who are not familiar with the intricacies of market activity. Because tick charts can display a large amount of data, it can be difficult to identify trends and patterns, especially for traders who are new to technical analysis.
Time-Based Charts
Time-based charts display price movements based on a specific time interval, such as one minute, five minutes, or one hour. Each bar on a time-based chart represents the price movement that occurred within that specific time interval.
One of the main benefits of time-based charts is that they are easier to read and understand. Because time-based charts display price movements over a set period, it is easier to identify trends and patterns in the market. This can be particularly useful for traders who are new to technical analysis or who prefer a simpler approach to chart analysis.
Another benefit of time-based charts is that they can be useful for identifying longer-term trends in the market. Because time-based charts display price movements over a set period, they can help traders identify key levels of support and resistance that are relevant over a longer time frame.
However, time-based charts may not capture all of the price movements that occur within a specific time period. This can make it difficult to identify intraday trends and patterns that may be relevant to short-term traders. Additionally, time-based charts may not provide the same level of accuracy when it comes to identifying key levels of support and resistance as tick-based charts.
Conclusion
Both tick-based and time-based charts have their own unique benefits and drawbacks. Traders should consider their trading style, level of experience, and analysis goals when choosing which chart type to use. For traders who are looking for a more accurate representation of market activity and intraday trends, tick-based charts may be the better option. For traders who prefer a simpler approach to chart analysis and are looking to identify longer-term trends, time-based charts may be more suitable. Ultimately, the choice of chart type will depend on the individual trader's preferences and goals.
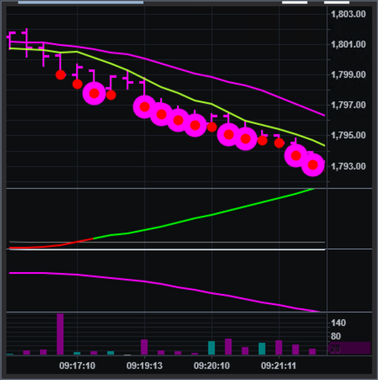
Analysis of a Trade
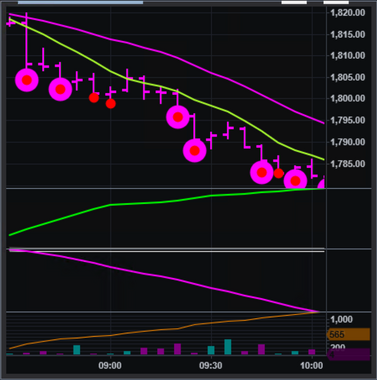
The chart displayed above represents an actual trade that was initiated by an alert message from Stronger Trades (demo available). As depicted in Chart 1, the live stream indicates that prompt action is required. Additionally, Chart 2, which is a time-based version of Chart 1, confirms the need for action.
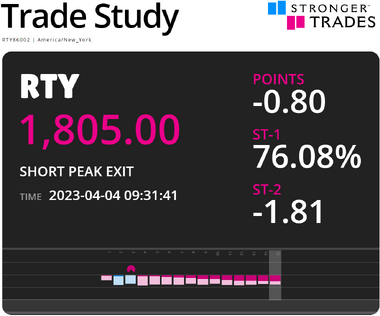
This trade was completed in approximately 16 minutes, resulting in a profit of over $500 US. If you are interested in learning how to trade like this, visit our home page at strongertrades.com. The trade signal was provide by the Trade Study.
Posted: 2023-04-05 13:26:06
- The Journal: Trader Blog
- Category - Alerts & Notifications
- Category - Chart Analysis
- Category - Diversification
- Category - Education
- Category - Fed Day
- Category - Futures trading
- Category - High returns
- Category - Leverage
- Category - Livestream
- Category - Market Fluctuations
- Category - Market volatility
- Category - Opinion
- Category - Performance
- Category - Recession
- Category - Reflexes
- Category - Risk management
- Category - Speculation
- Category - Success rate
- Category - Tips
- Category - Trade of the Week
- Category - Trading Class
- Category - Treasury Bonds
- About Stronger Trades
- Learn to Trade
- Membership Benefits
- The Trade Study